Slide 119 of 127
Notes:
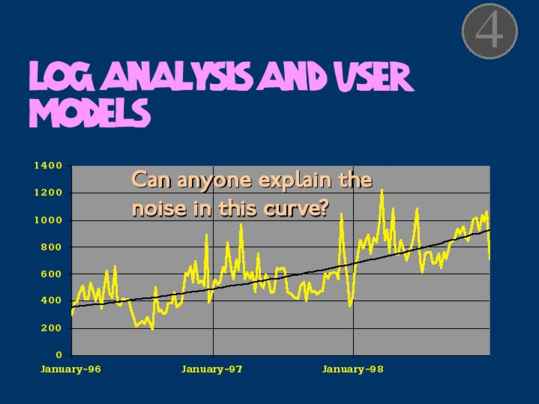
Take a look at this graph. It's the weekly traffic at one typical page on an actual Web site, over a span of three years.
Can you explain the noise? The fluctuations are BIG, and they don't follow a Poisson distribution like you'd expect. They are probably NOT due to simple effects -- things like ‘the server was down'.
Today, everybody has graphs like this.
This is just one of a host of simple problems with very practical implications. We need to understand web logs and other manifestations of reader activity.


